Matt Tillett, fund manager of the Premier Miton UK Value Opportunities Fund, looks for mis-priced stocks across the entire market cap spectrum. Here’s his take on UK SMID right now – including potential catalysts for change.
As a fund manager with a multi-cap strategy, I have no pre-ordained target exposure other than to maintain a degree of balance. Any investment idea, regardless of whether it is a mega-cap or a micro-cap, has to justify its place in the portfolio on its own merits and not simply because it is a big index constituent. We follow this approach for several reasons, but the overarching factor is because we believe it will deliver superior long-term results.
So, why UK SMID?
Our experience has shown that we are far more likely to find mis-priced stocks amongst SMID companies than amongst the large-caps. That’s not to say FTSE 100 Index companies can’t also be mispriced. It’s just less likely to happen in our view. We believe a huge value opportunity exists across the UK SMID sector, and our own investment decisions clearly reflect this.
Why are we so bullish on UK SMID right now?
Fundamentally, the reason is very simple: Better quality companies, exhibiting faster earnings growth, with similar or lower financial risk, at low absolute and relative valuations. History tells us that this combination is a recipe for success.
What can comparing the FTSE 100 Index vs FTSE 250 Index tell us?
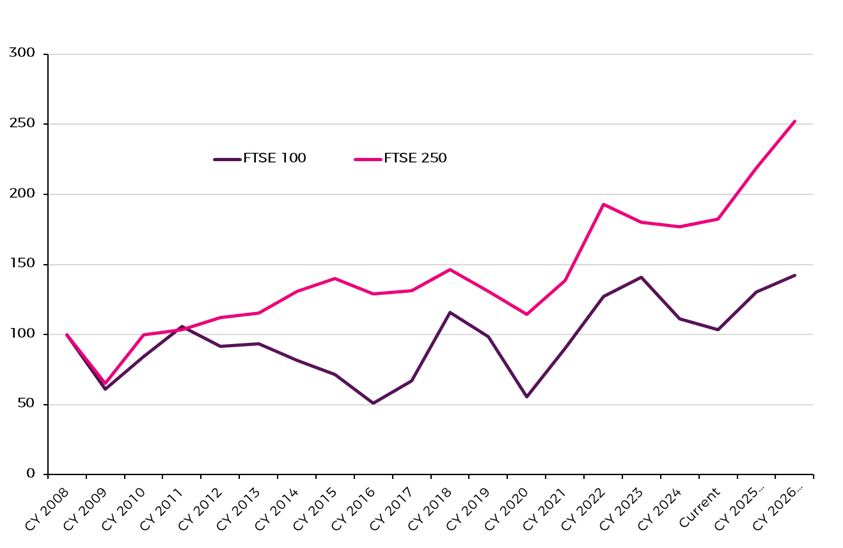
To illustrate this point, let’s start by comparing the FTSE 100 (companies above c £4bn market cap) with the FTSE 250 (companies between £0.5bn and £4bn market cap). The chart below shows the earnings growth trajectory for each index from the pre- Global Financial Crisis peak to today, with two years of consensus forecasts included.
FTSE 100 Index earnings versus FTSE 250 Index earnings

Source: Bloomberg 01.01.2008 – 02.03.2025.
Past performance is not a reliable indicator of future returns.
Over this period, the FTSE 250 Index has trounced the FTSE 100 Index in terms of earnings growth. This has happened despite some major macro headwinds that, on paper at least, should have impacted the FTSE 250 Index more than the FTSE 100 Index. The FTSE 250 Index is more domestically focused, and this period has been one of the weakest on record for the UK economy. The pound has also fallen in value. That the index has still overall managed to deliver a half decent growth in earnings is, in our view, a reflection of the underlying growth and quality drivers that underpin many of the companies within it.
The FTSE 100 Index has also had headwinds over this period, such as the high weighting to the banking sector, as well as energy and mining, which suffered from macro pressures during the 2010s, although they have now largely recovered from this. But it is also a reflection of the more mature nature of the companies that make up the FTSE 100 Index. Large companies in mature industries struggle to grow sustainably, and this is unlikely to suddenly change.
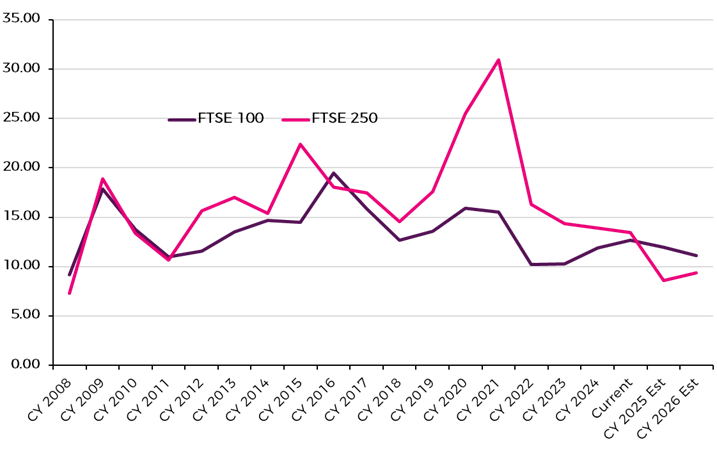
In normal times, one would expect these fundamental differences to be reflected in valuation. And indeed, if we look at the history this is exactly what we see – most of the time the FTSE 250 Index has traded at a higher valuation than the FTSE 100 Index.
P/e – FTSE 100 Index versus FTSE 250 Index

Source: Bloomberg 01.01.2008 – 02.03.2025.
Past performance is not a reliable indicator of future returns.
But this is not the case today. Currently the FTSE 250 Index is trading on a prospective p/e of under 10x, far below its long run average (16x) and also below the FTSE 100 (12x versus 13x long run average).
Why does this strange situation exist?
These points are interesting, but they are by no means novel. Most UK equity investors are well aware that UK SMID has outperformed the FTSE 100 Index over the long term and that UK SMID is unusually cheap today. So, why has UK SMID underperformed, why is the valuation so low, and do the answers offer any insights into what might make this situation turn around?
1. Domestic exposure
UK SMID has a greater exposure to the domestic economy than the FTSE 100 Index. This is well-known and it is easy to see how it gets reflected in short term share price movements. Whenever a negative piece of news flow surfaces in relation to the UK economy, UK SMID almost always underperforms the FTSE 100 Index. Considering the deterioration in sentiment towards the UK economy in recent months, it is perhaps not surprising that UK SMID has underperformed.
It is undeniably true that UK SMID has a greater exposure to the domestic economy than the FTSE 100 Index, but the extent to which this is the case may be less than many people realise. According to our estimations, the FTSE 250 Index is approximately 41% domestically exposed, which we define as companies that have more than 75% of their revenues coming from the UK economy, with the remainder split between pure international earners and hybrids that have a bit of both.
For sure, this is a significant exposure, but it still leaves a heck of a lot that isn’t entirely exposed to the UK economy. It is precisely these companies where we are finding some of the very best value opportunities – geographically diverse, resilient business models whose share prices trade as though they are highly risky cyclical domestics. As contrarians, we must take these opportunities when they present themselves.
The UK Value Opportunities Fund itself is currently 30% domestically exposed, higher than the FTSE 100 Index but lower than the FTSE 250 Index. This is reflective of the fact that we continue to find many value opportunities amongst the domestically focused companies. But we are also cognizant of the idiosyncratic risks associated with a single economy such as the UK, hence this is a correlated risk factor that needs to be managed carefully within the portfolio.
Estimated revenue exposures
| FTSE 100 | FTSE 250 | Fund | |
| Domestic | 13.2% | 41.4% | 29.7% |
| Hybrid | 9.5% | 24.5% | 25.5% |
| International | 75.7% | 34.1% | 43.7% |
Source: Bloomberg, Premier Miton Investors. Estimates as at 05.02.2025.
2. Economic cyclicality
Another reason that may explain the lower valuation of UK SMID is greater economic cyclicality at a time when there are concerns about the state of the economy. Here again there is an element of truth to this. But we question whether this is actually a negative. Most of the cyclical companies within the FTSE 250 are already very beaten up, both in terms of their profitability and share prices. Historically this is usually the time to buy cyclicals rather than sell them.
On our estimates, the FTSE 250 Index has a slightly lower exposure than the FTSE 100 Index to what we label as “highly cyclical” companies – business models that combine a high level of volume and price cyclicality, such as house builders, banks, airlines, big ticket retailers etc. But it has a substantially larger exposure to what we term “moderately cyclical” companies. These are business models that are impacted by the ups and downs of the economy but not in a particularly severe way – for example volumes may be impacted but not price, meaning profit margins tend to be more stable. By number this is the largest group in the market, which is unsurprising as most business models are impacted by the economic cycle to some extent. The fund is also heavily exposed to this this area. The FTSE 100 Index is unusual in having a relatively large exposure to “defensive” business models, due to the large weightings to sectors such as consumer staples, tobacco and healthcare.
Estimated revenue exposures
| FTSE 100 | FTSE 250 | Fund | |
| Highly cyclical | 22.6% | 15.9% | 23.5% |
| Moderately cyclical | 32.0% | 62.8% | 50.4% |
| Defensive | 43.1% | 16.3% | 17.5% |
| Uncorrelated | 0.6% | 5.0% | 7.6% |
Source: Bloomberg, Premier Miton Investors. Estimates as at 05.02.2025.
The argument that UK SMID deserves a lower valuation due to its greater economic cyclicality would be valid if the cyclical elements within it were over inflated at the peak of the cycle, and therefore likely to fall. There have been plenty of times in the past when this has been the case, but we don’t believe it to be the case today. If anything, the reverse is true. It’s been two and half years since the inflation and cost of living crisis shock. Since then interest rates have shot up, economic activity has slowed, and the UK economy experienced a mild recession. This has caused many areas of the economy to contract meaningfully with profitability falling a lot.
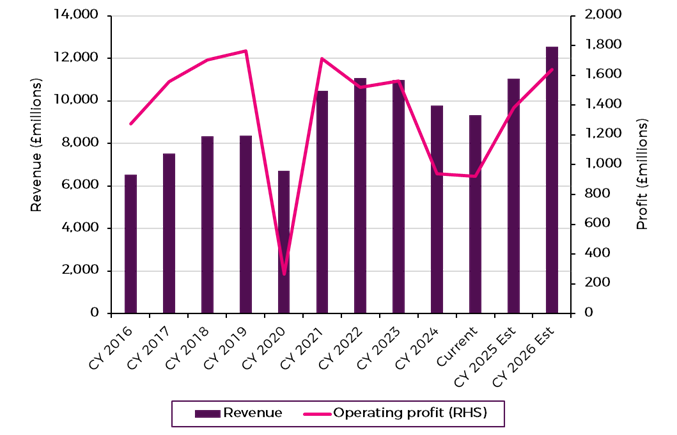
Take the housebuilding sector as an example. There are seven companies that make up this sector. Peak revenues were £11bn in 2022 and peak profits were £1.7bn way back in 2019. By contrast, Bloomberg consensus estimates expect £9.8bn and £1.0bn for 2024, which is expected to grow materially in the coming years. And that’s not pie in sky either. Most housebuilders are reporting increases in volumes and improving sales rates. And nor should this be surprising after such a prolonged period of weakness, especially now that consumers are seeing wages grow again.
UK housebuilding: 2016 – 2026

Source: Bloomberg 30.12.2016 – 02.05.2025.
3. Interest rate sensitivity
This is another factor that has impacted UK SMID more than the FTSE 100, due to there being a greater preponderance of interest rate sensitive business models in the UK SMID sector. Smaller companies in general tend to be more interest rate sensitive, in part because their lenders are more likely to be banks providing credit on a variable rate basis, whereas larger companies can borrow at fixed rates in the corporate bond market.
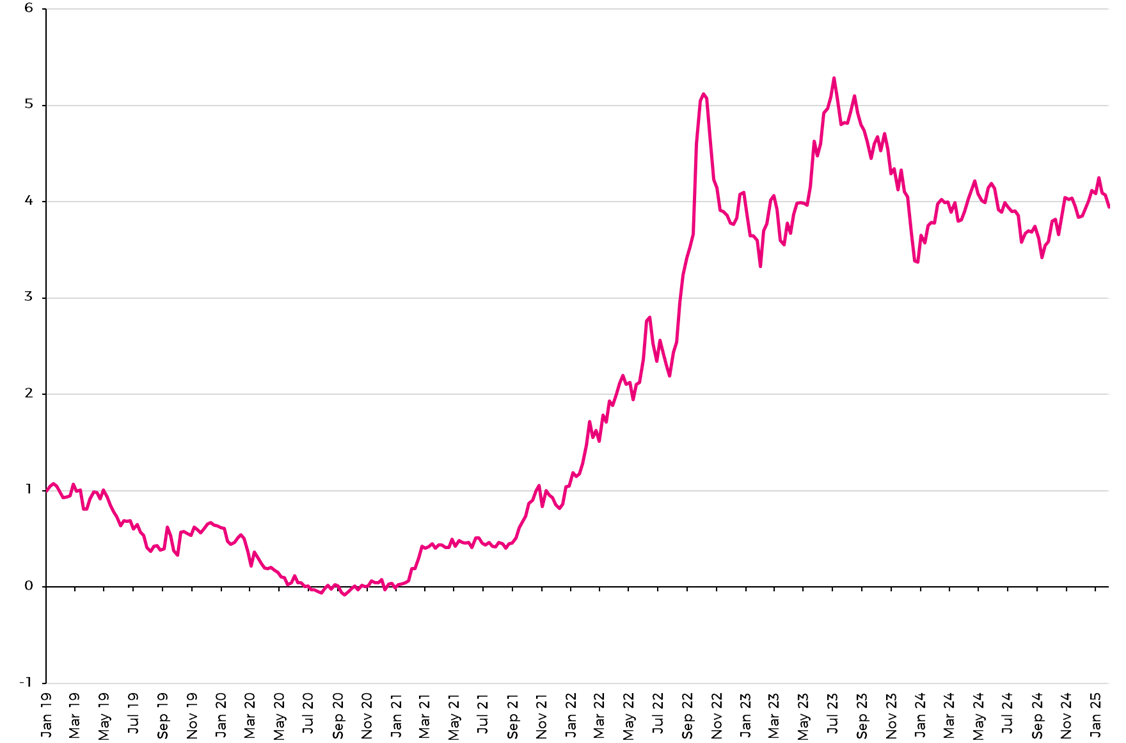
It is understandable why the UK SMID sector was negatively impacted relative to the FTSE 100 during the period when interest rates were rising. This process necessitated a recalibration of expectations from a low to a higher interest rate environment. But we should be careful not to confuse a rate of change argument with a level argument. Interest rates have indeed risen compared to where they were pre-2022, but the current level does not look elevated by the standards of the last two and half years, nor indeed by the standards of several decades prior to 2008. The 5-year swap rate currently stands at 3.9%, which is about the average since mid-2022.
GBP 5-year swap rate

Source: Bloomberg 04.01.2019 – 31.01.2025. Past performance is not a reliable indicator of future returns.
Like the economic cyclicality argument, this is backward looking in nature, whereas what really matters is how the companies and sectors most exposed to this will trade going forward. Unless one believes interest rates are going to move even higher from here, interest rate sensitivity should not be a reason for UK SMID to trade on such a low valuation.
Again, this point can be best illustrated with an example. The listed real estate sector is the most directly exposed to interest rates. It makes up 8% of the FTSE 250 Index, versus just 1% for the FTSE 100 Index, and it has fallen over 40% from its peak in 2022. According to Peel Hunt, the sector trades at a 30% discount to net asset value (NAV). But this is on capital values that have fallen 25% - in other words, they have largely adjusted to the higher interest rate environment. Moreover, most property companies are now reporting strong rental growth and stability in capital values, suggesting that the outlook is totally changed from what has occurred over the previous 2.5 years, yet the valuations imply the complete opposite. In our view, this is likely to be the best buying opportunity for the sector since the post-GFC recovery.
What are the potential catalysts for a change?
There is little doubt in our minds that we are being presented with a highly unusual situation here. A segment of the market that offers compelling quality and growth, as well as potential cyclical recovery, is trading at a remarkably low valuation, both in absolute and relative terms. As value-contrarian investors, we always seek to take advantage of these situations, as we are doing today.
The question of “the catalyst” is an important one, for if there is “no catalyst” then the fear is that cheap stocks just stay cheap forever.
Below are a number of potential catalysts that could cause this situation to change for the better.
- Improving UK macro sentiment – as noted above, the importance of the UK economy to the fundamentals of UK listed stocks is not that great even amongst the UK SMID sector.
- But it is clear that investor perceptions towards the UK economy have an outsized impact on the performance and valuation of the UK SMID sector. Therefore, any improvement on this front would likely have a large positive impact.
- Note here that improvement does not have to mean “good” – sentiment is so depressed that “less bad” should be enough, at least initially.
- Interest rate stability or better still, declines. This does depend to some extent on what is causing interest rates to decline. A rapid and material decline would likely only happen in response to a major negative macro event, which would itself require a reassessment of circumstances. But stability or gentle decline against a backdrop of an economy that holds up ok would be welcome.
- End of the Ukraine war – this seems more likely now than at any time since it started back in 2022. It would be very positive for the broader European macro environment and sentiment, with the depressed cyclical industrial sectors benefiting most.
- Ending or questioning of the AI / technology boom – we do not claim to be experts on this, but there are certainly some cracks emerging in the AI narrative (Deepseek, huge Capital Expenditure bills, declining Return on Capital Employed etc). If investors were to start moving away from this, even in a limited way, the sums of money involved are huge relative to the size of the UK SMID sector.
- Improving liquidity conditions – much has been written about the deteriorating liquidity conditions in the UK stock market as capital has flowed out into global and US focused funds, which has impacted the UK SMID sector to a greater extent than the FTSE 100 Index. However, this effect can also work in reverse. If something were to change that caused liquidity conditions to improve as money flowed back to the UK, the response in share price terms would likely be dramatic and potentially very quick.
In conclusion, we would like to emphasize that these are not forecasts. It is very often a confluence of factors that come together, rather than one isolated event, and timing it is almost impossible. Furthermore, in our experience catalysts are usually only identifiable in hindsight. Explanations and narratives tend to emerge later on, after much of the share price moves have already happened, and we cannot wait for that to happen.
